
Geospatial analysis for supply chains: see what’s really happening on the land
Know where your suppliers are, whether land was deforested and how your crops are doing. GeoServices combines satellite monitoring, expert review and teams on the ground to give you clear, plot-level answers you can show to buyers, auditors and regulators.
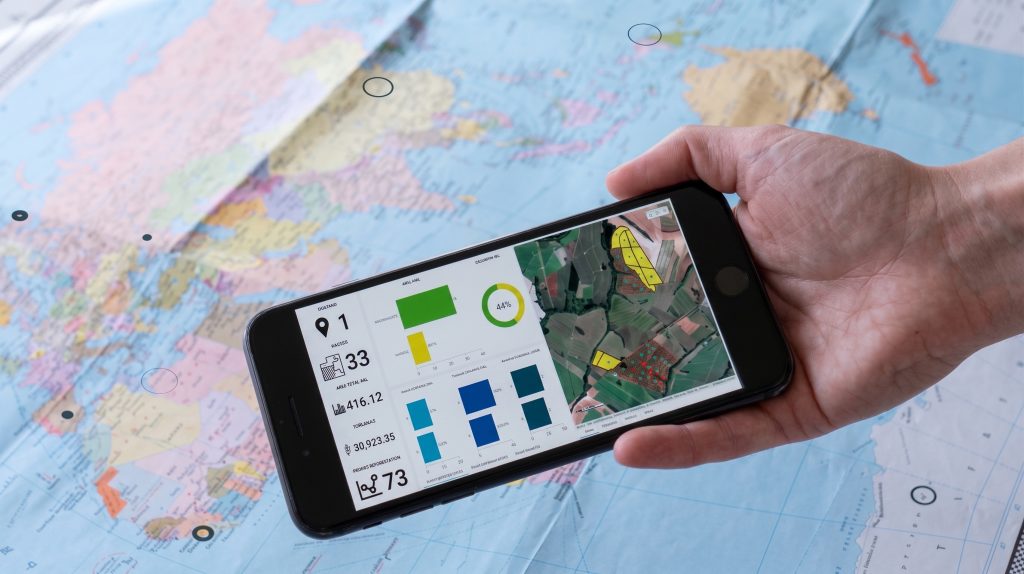
Geospatial analysis, explained simply
GeoServices is Peterson Technologies’ geospatial team. We use satellite images, maps and people in the field to show you what is happening on the land behind your supply chain. Most of the time it comes as part of a consulting project: you ask for EUDR readiness, certification support or crop advice, and the geospatial analysis comes inside it.
- Geospatial mapping of suppliers, farms and sourcing areas, down to the plot
- Satellite monitoring and land use change analysis, checked by experts
- Evidence you can put in front of a buyer, an auditor or a regulator
GeoServices in numbers
200+
projects delivered
34
countries covered
220M+
hectares analysed
80+
countries with local experts on the ground
A list of supplier names doesn’t tell you where your risks are
Most companies know who their direct suppliers are. Far fewer know exactly where their products are grown, whether that land was forest a few years ago, or which farms are struggling this season. Supplier questionnaires only tell you what suppliers say. Generic risk maps only tell you where problems might be. Buyers, auditors and regulators want proof.
GeoServices shows you which supplier, which piece of land, which risk, and what to do next.
- Locations nobody checked. Supplier locations that are missing, approximate or never verified.
- Risks you can’t trace. Warnings for a whole country or region that don’t point to a specific farm.
- Evidence that doesn’t hold up. Files that fall apart when an auditor asks for them.
- Suppliers off the grid. No GPS data, no digital systems, sometimes not even a phone signal.
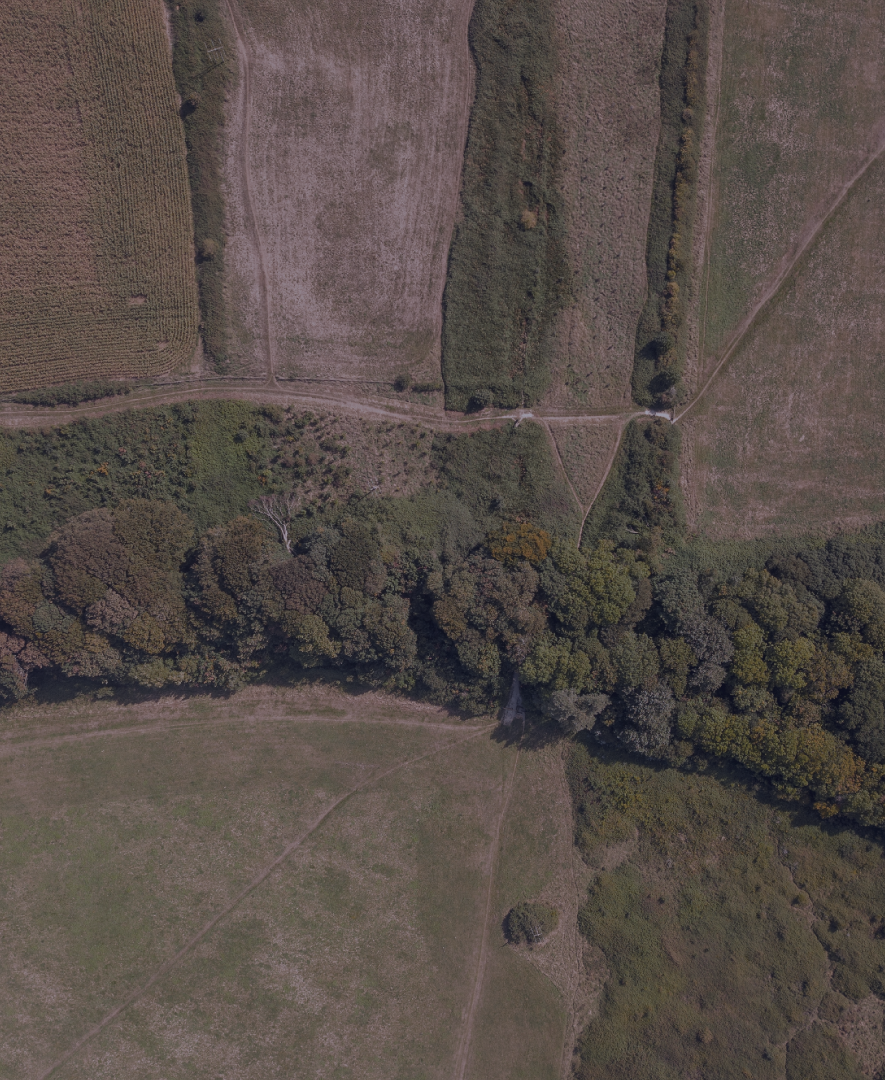
Geospatial solutions to know where your products come from
Each geospatial solution answers a simple question about your land or your suppliers. Most of the time it is part of a wider project with our consultants, so you get the answer and the support to act on it.
Supplier and farm mapping
“Where exactly are my suppliers, farms and sourcing areas?”
A verified map and database of your suppliers, farms and sourcing areas (tier 1, 2 and 3) that your whole team can use, plus digital field tools to replace paper records.
Used in: Traceability and supply chain mapping, EUDR, Certification support
Polygon mapping
“Do I have the exact boundaries of every plot I source from?”
Accurate plot boundaries (polygons) for each farm, collected the way your suppliers can manage: simple digital forms, guided collection with our experts, or our teams in the field where there is no connection.
Used in: EUDR, Traceability and supply chain mapping
Custom map platforms (WebGIS)
“How can my team see and use all this without being map experts?”
A simple online map platform built for your team, with your farms, suppliers and results in one place and easy dashboards for people who aren’t mapping specialists.
Used in: Traceability and supply chain mapping, Agronomy consultancy
Geospatial analysis to prove your land is compliant
Temporal analysis: deforestation and land use change
“Was this land deforested after the cut-off date?”
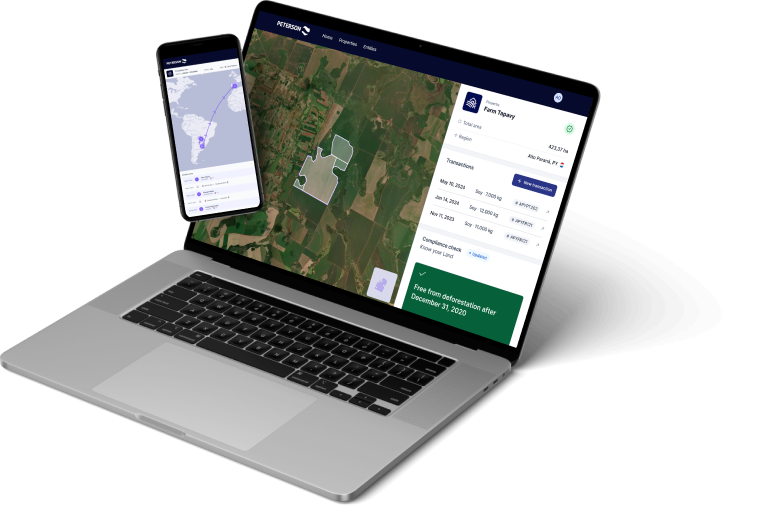
We compare satellite images of each plot over time (for EUDR, against 31 December 2020) and show clearly whether the land changed, with maps you can use as evidence.
Used in: EUDR, Supply chain risk analysis, Certification support
Spatial risk analysis
“Which suppliers or regions carry the most risk?”
A risk profile for each supplier or sourcing area, combining deforestation, land use, social and regulatory risks, and a clear list of where to act first.
Used in: Supply chain risk analysis, Sustainable sourcing, Social impact and compliance
Certification eligibility analysis
“Can these farms meet the land rules of the certification we need?”
A check of each producer’s land against the criteria of schemes such as ISCC, Bonsucro, RTRS and 2BSvs, a list of eligible and non-eligible producers, and maps that support your certification audit.
Used in: Certification support
Satellite monitoring to get more from your land and crops
Remote crop monitoring
“How are my crops and harvest developing across all my farms?”
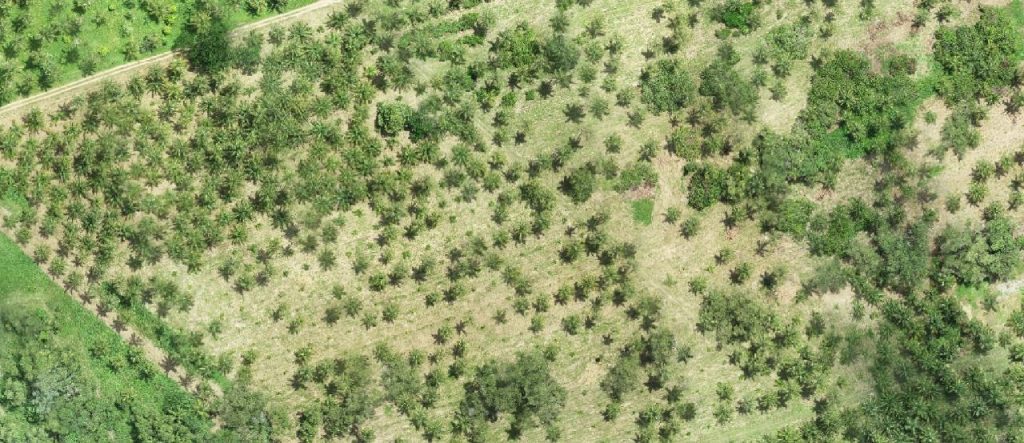
Regular updates on planted and harvested area, crop health and problem spots from satellite images, with field visits to check what the images flag.
Used in: Agronomy consultancy
Suitability analysis
“Where should we source, expand or restore land?”
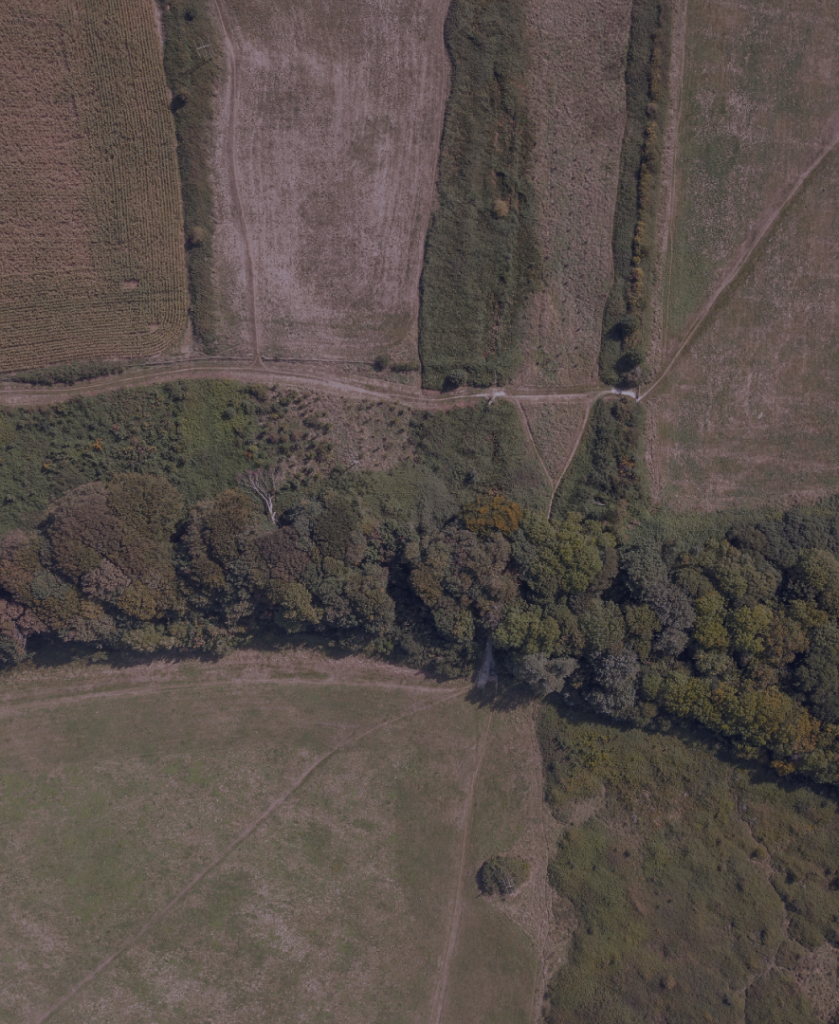
A map of the areas best suited for sourcing, expansion, reforestation or sustainability programmes, and the areas to avoid.
Used in: Sustainable sourcing, Regenerative agriculture
Mycotoxin risk forecasting
“Which of my crops are at risk of mycotoxins this season?”
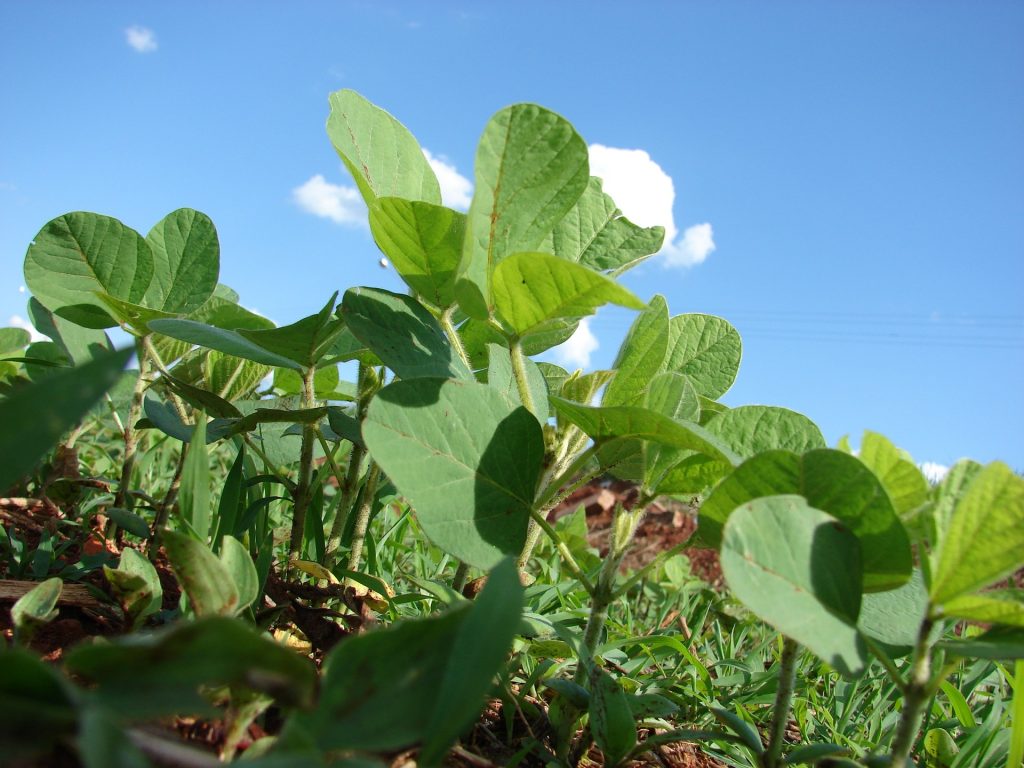
An early warning of mycotoxin risk (toxins produced by fungi that can make grain unsafe) for crops such as corn, wheat, soybean, rice and sorghum, combining crop, weather and location data in an easy-to-read map dashboard.
Used in: Agronomy consultancy
Maps are the start. Our consultants help you act on them.
GeoServices rarely works alone. Our geospatial experts work side by side with Peterson’s consultants, so the analysis answers the question behind your project and turns into decisions, supplier action plans and evidence for your audit or regulator.
- EUDR compliance: plot maps and deforestation evidence for your due diligence, also available with our EUDR compliance software
- Supply chain and responsible sourcing: supplier mapping, deforestation and risk analysis
- Certification support: land eligibility checks and maps for your audit
- Agronomy consultancy: crop monitoring, suitability and mycotoxin risk
- Social impact and compliance: mapping where risks to workers and communities sit in your supply chain
From supplier list to proof you can use
Understand your question
What do you need to know or prove, for which products, regions and suppliers?
Gather what you already have
Supplier lists, addresses, coordinates, maps: whatever you have. We organise it.
Fill the gaps
We reach suppliers through simple digital forms, guide them step by step, or go to the field ourselves.
Analyse the land
Our experts analyse satellite images and other data about each location.
Deliver answers and next steps
Clear maps, reports and a ready-to-use evidence pack, plus priorities for what to do next.
You go from “we think we know” to “we can prove it”.
Book a scoping call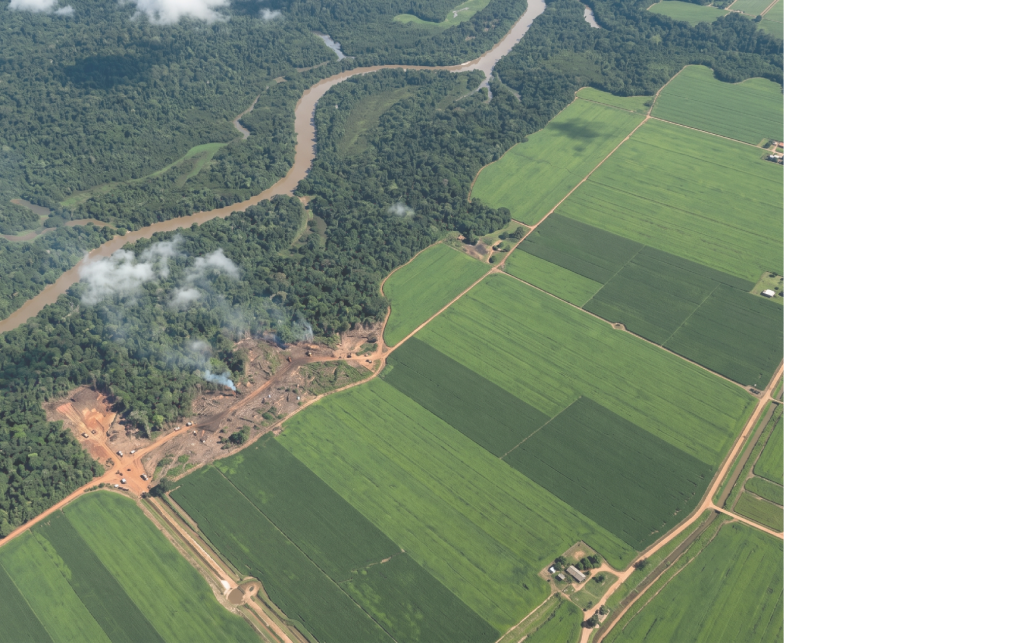
The geospatial experts behind the maps
Geo experts and field teams work together, so the answer is right on the screen and on the ground. Behind every map there is a team you can talk to, who know the land, the standards and the questions auditors ask.

Caio Lourencini Cavellani
GeoServices & Data Analytics Manager, Peterson Technologies
Caio Lourencini Cavellani is GeoServices & Data Analytics Manager at Peterson Technologies, a geographer leading georeferenced data solutions for supply chain traceability and land use analysis.

Amanda Morelli
Geoservices Coordinator, Peterson Technologies
Amanda Morelli is Geoservices Coordinator at Peterson Technologies in São Paulo, Brazil, with a background in geoprocessing and socio-environmental compliance for agricultural supply chains.